Hard Drive Temperature Monitoring with RRDTool
This page describes the use of RRDTool for
monitoring hard drive temperatures on a Linux server.
Background
See my Installing RRDTool page for detailed info on
installing and configuring RRDTool.
Note that this page assumes all directories and installation locations are
as per the page mentioned above.
If your configuration is different, you may need to adjust some parts of the installation instructions appropriately.
Screen Shots
Here's a screen shot of the summary page. This page displays the daily graphs
for each of the HDDs being monitored (in my case, only one HDD).
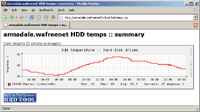
the hddtemp summary page (only one HDD being monitored)
And here's a screen shot showing the daily, weekly, monthly and yearly graphs
for one of the HDDs.
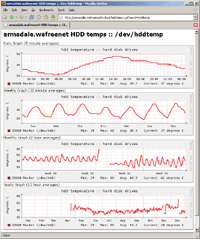
daily, weekly, monthly and yearly graphs
(Note that the HDD temperatures shown above are not typical for most PCs, as the
above HDD temperatures are from a PC that is
mounted in a closed cabinet, and
suffers from much greater temperature fluctations each day than a PC would
normally encounter in a typical home/office scenario.)
Requirements
You'll need:
- a Linux box
- one or more HDDs with SMART support
- a web server running on the Linux box
- a working installation of RRDTool, including the shared RRD perl module
-
hddtemp
tarball and hddtemp.db
-
my rrd_hddtemp.pl script for data collection
and graph generation
-
my hddtemp.cgi webpage for viewing the graphs
-
an SCP client (such as WinSCP
or FileZilla)
for copying files onto your linux box.
-
a way of getting a command-line prompt on your linux box
(either by logging directly onto your linux box,
using a SSH client such as
PuTTY
or SSH Secure Shell).
Note that the information on this page was originally written for configuring traffic monitoring on
Red Hat 7.3 linux, but has since been updated for
Ubuntu linux.
If your configuration is different, you may need to adjust some parts of the script
appropriately.
Installing hddtemp on Ubuntu
Install hddtemp by running:
sudo apt-get install hddtemp
Installing hddtemp on other Linux versions
SCP the hddtemp tarball into the /usr/src/ directory
on your linux box. From a command prompt, change into the
/usr/src/ directory, and un-tar the tarball:
cd /usr/src
bunzip2 hddtemp-0.3-beta14.tar.bz2
tar xvf hddtemp-0.3-beta14.tar
Change into the newly created directory:
cd hddtemp-0.3-beta14
Compile and install hddtemp:
./configure --with-db-path=/etc/hddtemp.db
make
make install
Note that I had to install a required dependency before I could successfully
compile hddtemp, namely gettext-0.11.1-2.i386.rpm.
You may or may not have to install any dependancies, depending on the packages
you already have installed.
The hddtemp database, hddtemp.db, needs to be
SCP-ed into the /etc/ directory on your linux box.
This text file contains a list of hard drives that hddtemp recognises, as
well as information hddtemp uses to decode the temperature.
Linux Hard Drive Naming Convention
Linux uses a very different naming convention than Windows for hard drives.
The hard drives are named after their physical connection.
Sample hard drive names are as follows:
|
/dev/hda
|
master device on primary IDE channel
| |
/dev/hdb
|
slave device on primary IDE channel
| |
/dev/hdc
|
master device on secondary IDE channel
| |
/dev/hdd
|
slave device on secondary IDE channel
| |
/dev/sda
|
first SCSI hard drive
| |
/dev/sdb
|
second SCSI hard drive
| |
...
|
|
Getting Data
The next task is to verify that hddtemp can retrieve the temperature from
your hard drives.
Test hddtemp by running the following (replacing /dev/hda with
a valid hard drive in your linux box):
hddtemp /dev/hda
and see if a temperature is reported.
If you have more than one hard drive in your linux box, repeat this for
each additional physical hard drive, to determine which ones hddtemp
can obtain a temperature reading.
On one of my Linux servers, with one SCSI and two IDE hard drives,
I had the following hddtemp output:
[root@thain tmp]# hddtemp /dev/sda
/dev/sda: :  known drive, but it doesn't have a temperature sensor.

[root@thain tmp]# hddtemp /dev/hda
WARNING: Drive /dev/hda doesn't seem to have a temperature sensor.
WARNING: This doesn't mean it hasn't got one.
WARNING: If you are sure it has one, please contact me (coredump@free.fr).
WARNING: See --help, --debug and --drivebase options.
/dev/hda: QUANTUM FIREBALLP AS30.0:  no sensor

[root@thain tmp]# hddtemp /dev/hdc
/dev/hdc: ST340016A: 40°C
From the above, I can see that hddtemp didn't recognise
/dev/sda (an old 4GB SCSI),
it correctly detected /dev/hda as a
Quantum Fireball AS30 without a temperature sensor,
and detected /dev/hdc as a Seagate ST340016A
with a temperature of 40°.
Automating Data Collection
Passing an additional parameter to hddtemp will cause it to display only
the temperature for the specified hard drive:
[root@thain tmp]# hddtemp -n /dev/hdc
40
To automate data collection, I wrote a Perl script which performs the following tasks:
- retrieve data
- push data into the RRD database
- generate daily, weekly, monthly and yearly graphs
You can download a copy of my
rrd_hddtemp.pl script.
Rename it to rrd_hddtemp.pl, and save it in
/usr/local/bin/.
Make it executable by changing the file permissions on it:
chmod 755 /usr/local/bin/rrd_hddtemp.pl
and adjust the settings defined at the top of the script to make them appropriate
for your linux box, including the interface name, and the interface description:
# define location of rrdtool databases
my $rrd = '/var/lib/rrd';
# define location of images
my $img = '/var/www/html/rrdtool';
The following lines in rrd_hddtemp.pl specify which
HDD's will have their temperature monitored.
Add/modify/delete any lines here as appropriate (lines can be commented out with
a "#" character).
# process data for each specified HDD (add/delete as required)
#&ProcessHDD("hda", "primary master");
#&ProcessHDD("hdb", "primary slave");
&ProcessHDD("hdc", "40GB Seagate");
#&ProcessHDD("hdd", "secondary slave");
The above is configured to only monitor /dev/hdc,
so be sure to modify it to suit your configuration.
Test the script by executing it from a command prompt:
/usr/local/bin/rrd_hddtemp.pl
The first time the script is run, it'll create an RRD database for each hdd being monitored,
so you should see output similar to this
(assuming the script has been configured to monitor /dev/hdc):
[root@thain root]# /usr/local/bin/rrd_hddtemp.pl
40GB Seagate (/dev/hdc) temp: 41 degrees C
creating rrd database for /dev/hdc...
On any subsequent executions, you should see similar output, but without the
creating rrd database...... lines.
Once you've verified the operation of the script, it can be automatically
scheduled to run periodically. To get it to run every 5 minutes,
add the following to
/etc/crontab:
# get hdd temperatures
*/5 * * * * root /usr/local/bin/rrd_hddtemp.pl > /dev/null
Viewing the Graphs
Each time the script is executed, if required, it'll update the graphs of
the hard drive temperature(s).
These graphs are being created in /var/www/html/rrdtool/,
and assuming you've got a webserver running, they'll be accessible via
http://your_ip/rrdtool/.
To provide a much cleaner way to view these graphs, I've written a simple
webpage for displaying all the hard drive temperature graphs.
You can download a copy of my
hddtemp.cgi webpage.
Rename it to hddtemp.cgi, and save it in
/var/www/html/rrdtool/.
Make it executable by changing the file permissions on it:
chmod 755 /var/www/html/rrdtool/hddtemp.cgi
and adjust the settings defined at the top of the script to make them appropriate
for your linux box, in particular, the interface name:
# get the server name (or you could hard code some description here)
my $svrname = $ENV{'SERVER_NAME'};

# define hdds to display (add/remove as required)
#push (@graphs, "hda");
#push (@graphs, "hdb");
push (@graphs, "hdc");
#push (@graphs, "hdd");
Note that I'm assuming you've got your web server appropriately configured
to handle .cgi scripts. if not, refer to the
inline documentation in your httpd.conf or the Apache
documentation for more information.
You should now be able to point your web browser at
http://your_ip/rrdtool/hddtemp.cgi and you should
be rewarded with a summary page displaying the daily graphs of your hard drive temperatures.
Clicking any of the daily graphs will then display the detailed graphs for that HDD,
ie, the daily, weekly, monthly and yearly graphs.
More on Graphing Temperatures
If you are monitoring multiple HDDs in a single linux box, rather than having
separate temperature graphs for each HDD, it's possible to combine
multiple temperatures on a single graph.
Refer to the
Hard Drive Temperature Monitoring with RRDTool - part 2
for more details on the script modifications required to achieve this.
Comments on Data Storage
The script uses a single RRD database to hold the temperatures of each of the HDDs
being monitored.
The rrd_hddtemp.pl script uses the following syntax for creating
the RRD database:
rrdtool create /var/lib/rrd/hddtemp.rrd -s 300	\
         DS:temp:GAUGE:600:0:100		\
         RRA:AVERAGE:0.5:1:576			\
         RRA:AVERAGE:0.5:6:672			\
         RRA:AVERAGE:0.5:24:732			\
         RRA:AVERAGE:0.5:144:1460
This creates an RRD database with the following attributes:
- 5 minute step (base interval with which data will be fed into the RRD)
- 10 minute heartbeat for the data source
- 2 days of 5 minute averages
- 2 weeks of 1/2 hour averages
- 2 months of 2 hour averages
- 2 years of 12 hour averages
Refer to the
rrdcreate manpage for more information on these options.
References
Installing RRDTool
hddtemp
About RRD Tool
RRD Tool Documentation
last updated 14 Nov 2016
|


